Do you have a good idea of how money flows into and out of your life? Can you easily spot the areas that need to be automated? Reviewed? Increased or decreased?
If not, you might benefit from drawing a money map.
Years ago, when I tried to figure out how to create the best financial system for my family, I found myself overwhelmed. All the numbers were there, in multiple spreadsheets, but I couldn’t wrap my head around the big picture. Was I using the best accounts? The right number of accounts? Was I saving and investing enough?
That’s when I realized what the problem was: I’m a visual learner. I like to see how all the pieces fit in together.
The numbers were easy to understand, but it was hard to get a sense of the bigger picture. I wanted a birds’ eye view of my finances, the kind of thirty thousand-foot view you get when you’re in a plane looking down. From those heights, it’s easy to spot patterns, to understand the lay of the land (literally!).
The flow of money
So, I drew myself a picture outlining the flow of money coming into and out of my life – where it went, what it yielded (e.g. spending, debts, assets) , and how it came back (e.g. passive income, business income, etc).
I was inspired by an image I found in Robert Kiyosaki’s book Rich Dad, Poor Dad in which he uses four rectangles to illustrate the power of accumulating assets versus liabilities. His illustration was a good start, but I needed more depth.
That’s when I created my Money Map.
It worked.
I instantly saw how many accounts I have, the role they play in my finances, how much money is going into each major category, where I needed to spend time reviewing the results, where I could introduce automation, and what I needed to focus my attention on next.
I was so excited by the results that I started to share it with my private coaching clients. They loved it! It gave them an immediate grasp of their fundamentals – what they have, the gaps in their finances, and what they could improve.
Given how well it was received by my clients, I expanded it and included it as a module in my Take Charge of Your Money Course. Then I introduced it to my Women’s Money Group. It was a hit!
It’s your turn
Today, I want to share the basics of my Money Map process so that you, too, can create a visual representation of your money and your processes.
Here’s how it works.
Things to note:
Operate LEFT to RIGHT
Seek to optimize your system for greater clarity and results
Use the “Start-to-Filing” method of dealing with paperwork to minimize the number of times you touch a given document or receipt.
STEP 1
Tape two 8.5″ x 11″ blank pieces of paper together along the long edge. Place the paper vertically on your desk.
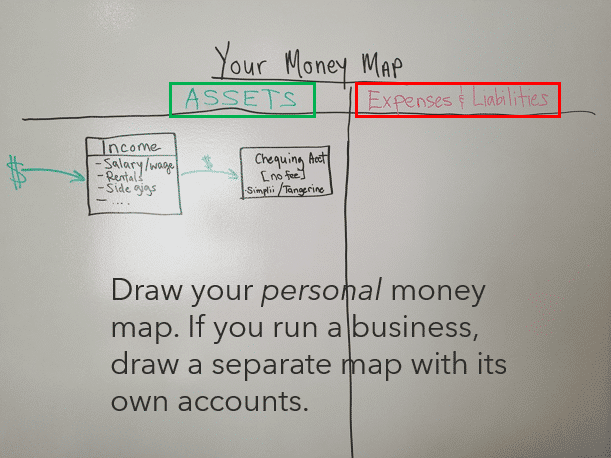
Write MY MONEY MAP at the top, then create one row at the top. Divide that row into two columns and extend the line down to the bottom of the paper (see the drawing below).
STEP 2
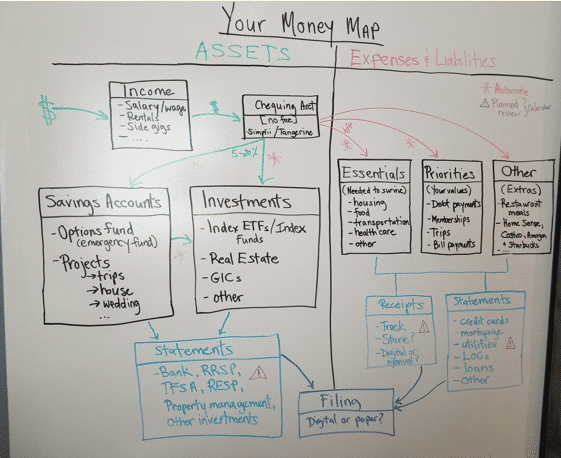
Label the top LH row ASSETS and the top RH row EXPENSES & LIABILITIES
Now it’s time to draw two rectangles on the left-hand side. The first is for your income and the second is for your chequing account(s).
It should look something like this:
In the above, you’ll note that I’ve used green for assets/income and red for expenses and liabilities. I use colour to make the flow of money, and its impact on my life, pop out.
It also makes it easy to determine if I have more green or red in my life at the moment.
In the Income rectangle, put in all your sources of income. If you want to go one step further, you can put in the amounts as well.
In the Chequing Account(s) rectangle, put in all the chequing accounts you have. I gave the example of Simplii and Tangerine above, as those were the two institutions I worked with at the time, though I recently booted Tangerine out of our life (here’s why).
STEP 3
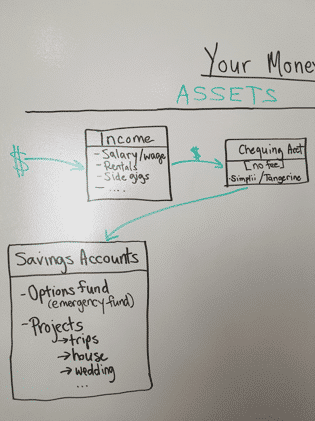
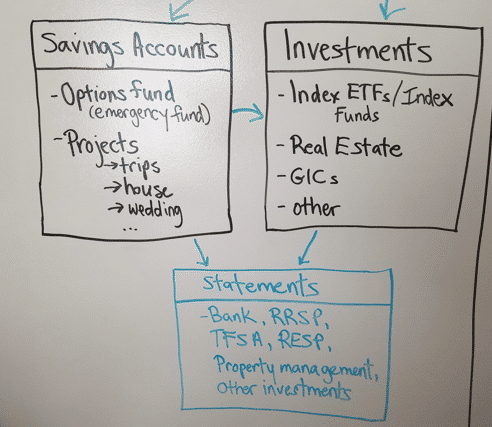
Create a rectangle for your savings accounts and list them all along with the banks where they reside.
My husband and I don’t have savings accounts (we send money straight to investments), which is why you don’t see the names of any banks in this rectangle. (I discuss why we do this, and when savings accounts are a good idea, in my video training on creating you Money Map.)
Moving left to right, we start by funding assets, not liabilities and expenses.
The reason I recommend doing this is that if you leave saving money until after all your monthly spending, you may end up struggling to save anything at all. You’ll be dealing with the leftovers.
Instead, I recommend starting with your savings to ensure you hit your targets.
There are only two exceptions to this rule for me:
When you have insufficient income to cover the basics.
When you have corrosive debt (i.e. credit card balances, line of credit debt, etc)
If either of the above exceptions applies to you, then a different approach is called for. Saving money isn’t your highest priority for now.
STEP 4
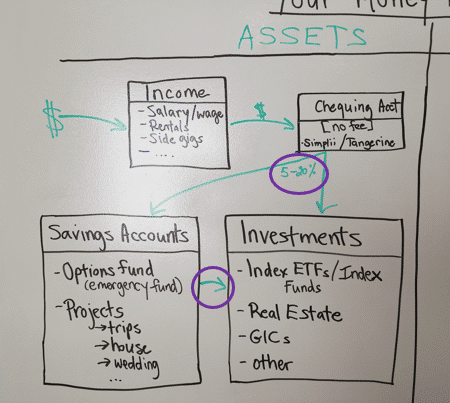
Create a rectangle for your investments and list them out. In the image below, I’ve given you a short list of possible inclusions.
In your own rectangle, you would put more detail. For example, if you have an RRSP at Questrade (as I have), you would indicate that. It’s not necessary to write out the holdings inside your RRSP (e.g. the specific funds you hold). I just gave those as examples to jog your memory about what you have and where it’s held.
Let’s say you have the following:
RESP – TD
RRSP – Questrade
RRSP – CIBC
TFSA – Simplii
GICs – Oaken
Unregistered account – Questrade
You would obviously have a number of holdings within each of those. It would be impractical to list them here! Just leave it at the above list and put the dollar figures next to each entry.
If, like me, you have real estate holdings that are personally held, you would list those in the Investments rectangle as well (e.g. townhouse, condos, duplex, etc).
STEP 5
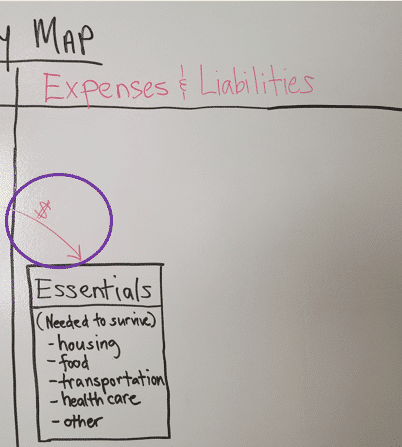
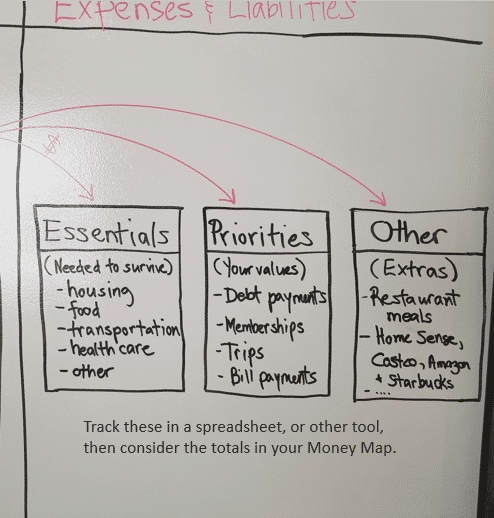
Now it’s time to pop over to the Expenses and Liabilities side of the drawing.
Draw a rectangle and list your Essential Expenses. These are expenses that are necessary for you to survive.
For example, you need food on the table, but you don’t need take-out. The former is all the stuff you buy at the grocery store and the farmer’s market to make meals at home.
The latter would fit into your discretionary spending.
Notice that I’ve used a red arrow to show the money leaving the asset side of the drawing and coming into the expenses and liabilities side. This means the money is leaving your account and flowing out of your life.
It may well be purchasing much-needed items; but it’s nonetheless flowing out.
STEP 6
Draw two more rectangles for your priorities and Other spending (i.e. discretionary spending).
Using the rule of moving from left to right, you would:
fund essential expenses first – a roof over your head, good food on the table, etc;
then, your values-based priorities (something which is central to the financial management system I teach);
then, everything else.
In this model, you take care of the most important items first – saving, investing, essentials, and priorities – before using the rest in whatever way you choose.
If you know that the important bits are taken care of, it’s far easier to enjoy the money that’s left, without guilt.
It’s also easy to see where there are shortfalls.
STEP 7
Pop back over to the assets side of the drawing and draw a rectangle below the savings and investment accounts.
It’s time to make note of all the statements you need to pay attention to.
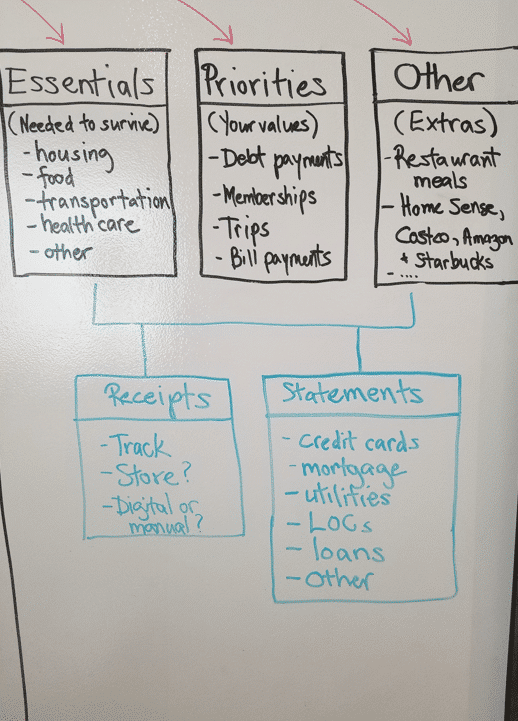
STEP 8
Ditto for the expenses and liabilities side, except now you have two sets of paperwork to pay attention to: receipts and statements.
Inside the rectangle for receipts, indicate if you prefer to keep and store, or dispose of receipts. Do you want digital copies or the paper copies? This will influence what kind of system you put into place.
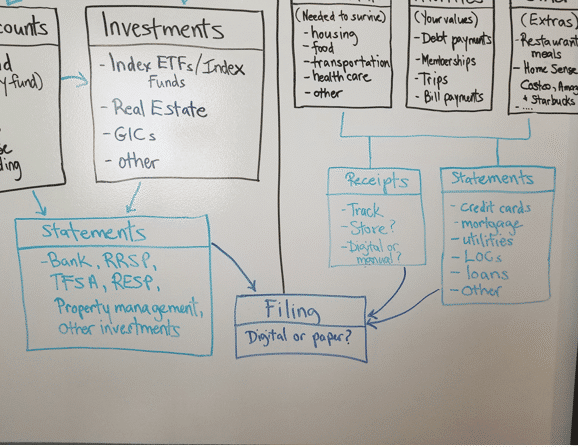
STEP 9
What are you going to do with the paperwork – keep digital copies and shred the paper, or keep the paperwork and file it?
Your decision here will determine what tools you need to maintain your system – filing cabinet; scanner; receipts app; your phone’s camera plus digital storage, and so on.
STEP 10
Build in automation and review.
Which parts of your process can you automate? I’ve used an orange asterisk in my drawing to highlight the bits that I suggest you automate.
What do you need to review? In my drawing, those areas are identified with a purple triangle.
These are the areas where you want to introduce oversight and a hands-on component. This is to ensure that your finances don’t proceed on automatic. (I wrote about the difference between automated and automatic finances here. You is helpful to your finances; the other is harmful.)
And there you have it – you have your own Money Map!
There’s more detail involved in order to create effective financial processes from here, but that’s beyond the scope of this blog post.
I created a video to fully explain the process, including strategies to minimize paperwork, what to watch out for, what to avoid, helpful targets, and the various tools I use to carry out the individual steps. That two-hour training is impossible replicate in a single blog post!
With the above, though, you have the essentials to create your own Money Map, then follow the money as it moves through your life.
What do you notice?
Are you growing your assets or is money flowing out through spending and liabilities (debt)?Where are the gaps (likely in the savings and investments rectangles, in my experience)?
Does your financial system flow from left to right (from building assets to spending and liabilities) or from right to left (spending first; saving and investing later)?
Spend some time with your Money Map to figure out which areas need attention and what systems you could implement to save time and increase the value you get from your money.
If you’d like to get your hands on my training and have me walk you through every step in detail, with all the tips, tools, and strategies I use, both in my own finances and with my clients, send me an email or a DM via my business Facebook page. I share where you can purchase my 2-hour training video for $97.
Good luck and have fun drawing! Pop back to leave a comment below about what you discover.
Want to receive my weekly money tips and strategies?
Don’t miss a thing! No spam, ever.
Share this post
2 Responses
What a cool system! A great way to visualize both an income statement and a balance sheet. I’ve not seen anything like it before. Thanks for sharing!


2 Responses
What a cool system! A great way to visualize both an income statement and a balance sheet. I’ve not seen anything like it before. Thanks for sharing!
Thanks, Jay! That’s what I was aiming for. I’m glad you like it. Thanks for popping by!